
When developing a Function, it's useful to be able to make changes and visualize them immediately. The Hypar CLI provides a way to run your function locally and test it in the context of a Workflow.
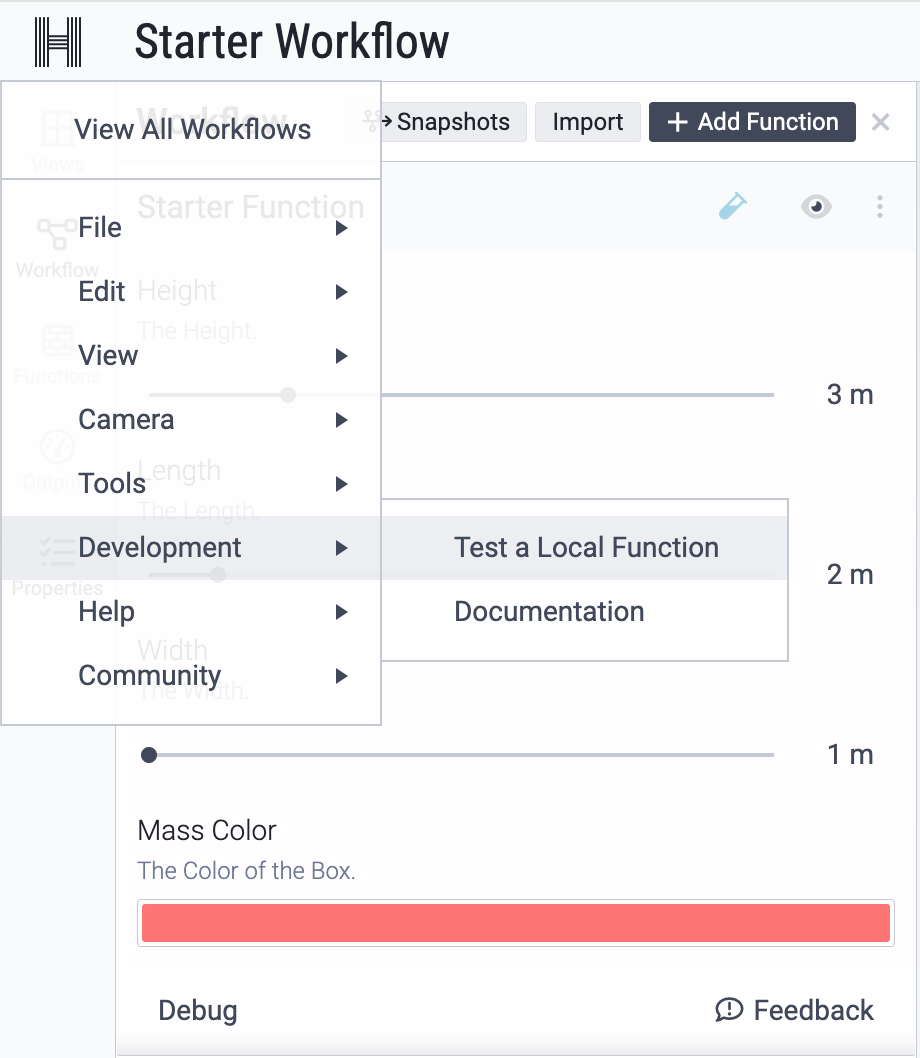
Navigate to the H menu on the upper left and select Test a Local Function from the Development section.
Click the "Copy to clipboard" beside the
hypar run command:Then return to your terminal, ensure you're in your project directory ("StarterFunction") and paste the copied command, which should look like this:
plain texthypar run --workflow-id={YOUR_WORKFLOW_ID}
Once you see the message below in the CLI, you’ll know your local Function is connected to Hypar!
plain textRegistering as a runner for workflow {YOUR_WORKFLOW_ID} and function {YOUR_FUNCTION_ID}.
Connecting to websocket...
Connected to websocket.
Runner registered!
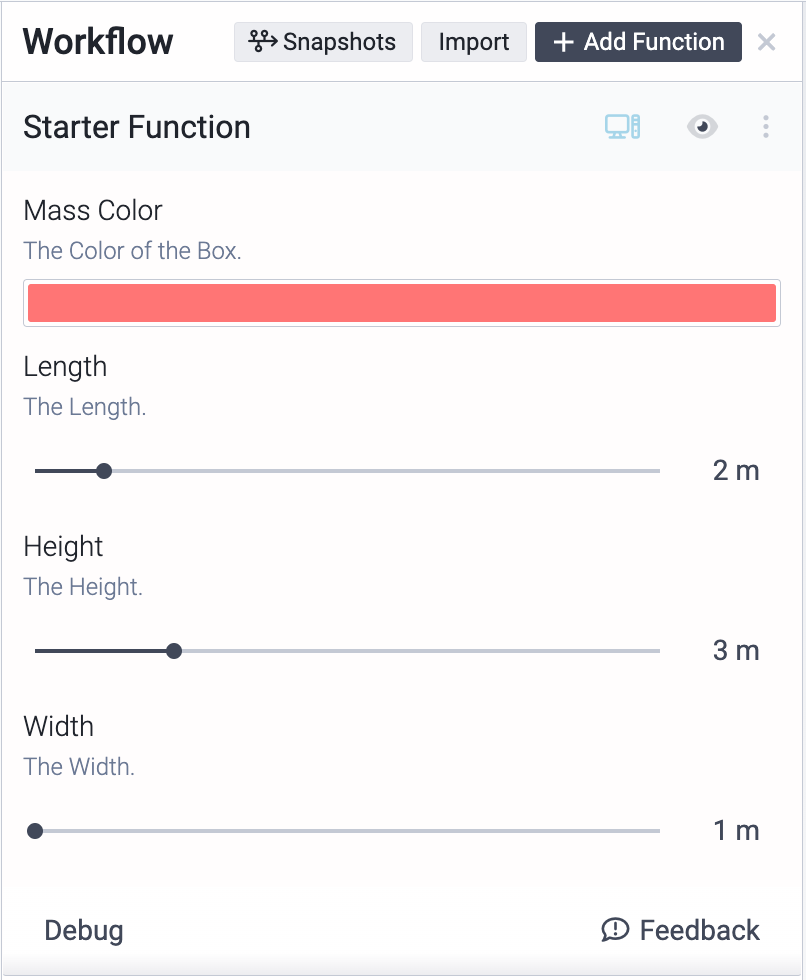
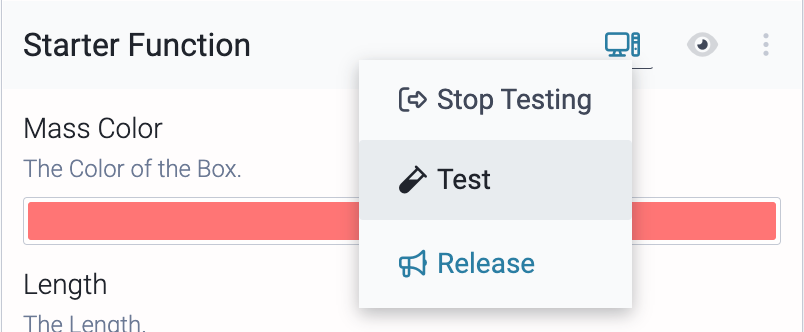
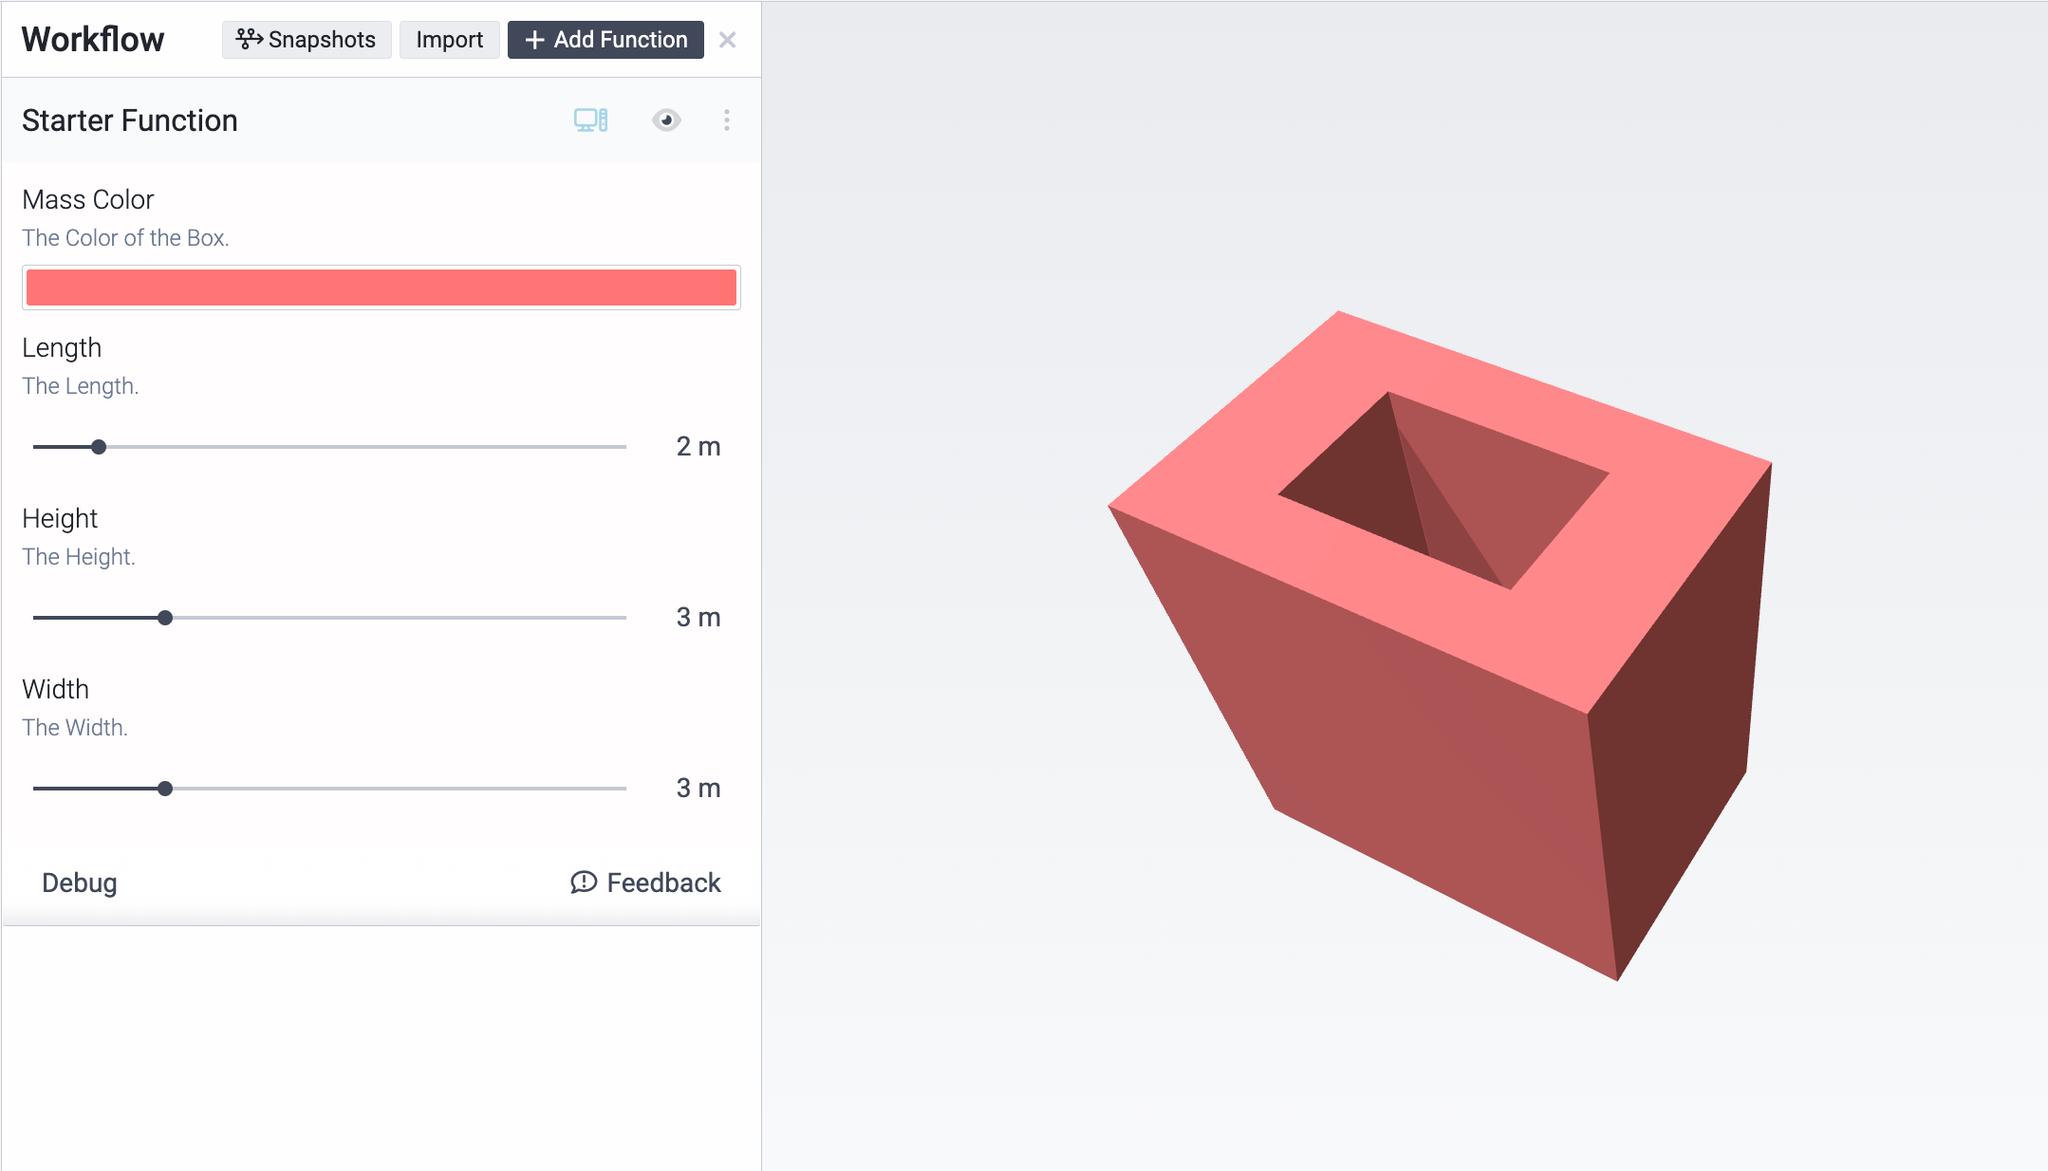
The desktop icon next to your Function name indicates you’re using your local Function instance. Clicking this icon will open up a context menu that allows you to Stop Testing, switch to Test mode, or Release the current test version.
Now, when you edit the inputs of the function, they're passed to your locally-running function, instead of being executed on the cloud, making function testing and debugging a breeze.
Working with hypar run
The
hypar run command we pasted earlier stays running continuously until we exit. While it's running, it serves the local function, and also monitors your code for changes. If you make changes to hypar.json or to your C# code, it will rebuild the function and re-execute dynamically. This makes it easy to write code, quickly try things out, and visualize how they will function on Hypar.Let's make some changes to our code with
hypar run running. We'll insert a void running through our mass. For this we'll need to create a smaller rectangle inside our first one, and create a profile from those two rectangles. First, we'll make the second rectangle:c#var innerRectangle = Polygon.Rectangle(input.Width * 0.5, input.Length * 0.5);
And then a Profile from the two rectangles:
c#var profile = new Profile(rectangle, innerRectangle);
And then edit the line where we make the
Mass to use our new profile:plain textvar mass = new Mass(profile, input.Height, material);
The updated
execute method should look like this:c#public static StarterFunctionOutputs Execute(Dictionary<string, Model> inputModels, StarterFunctionInputs input) { // create an output object var output = new StarterFunctionOutputs(input.Width * input.Length * input.Height, input.Width * input.Length); // create a rectangle var rectangle = Polygon.Rectangle(input.Width, input.Length); // create an inner void rectangle var innerRectangle = Polygon.Rectangle(input.Width * 0.5, input.Length * 0.5); // create a profile from the two rectangles var profile = new Profile(rectangle, innerRectangle); // create a new material var material = new Material("Box Color", input.MassColor); // create a mass from the rectangle var mass = new Mass(profile, input.Height, material); // add the mass to the output model output.Model.AddElement(mass); return output; }
As soon as you save your code, you should see the Function results update in your workflow:
When you're happy with your local changes, hit ctrl+C in the terminal to stop
hypar run.Finally, publish your updated function with
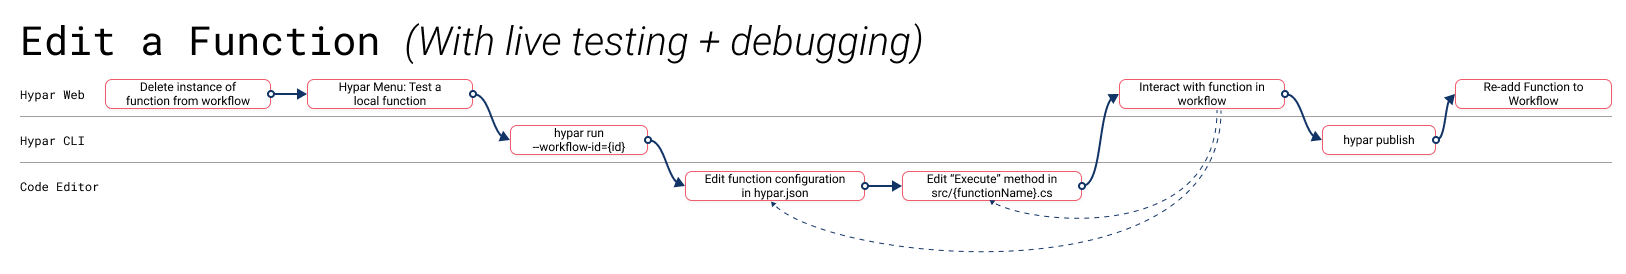
hypar publish. The next time you use it in a workflow, it will reflect the changes you made. Anyone you've shared your function with will also have access to the latest and greatest version you just published.This diagram summarizes the steps we've taken to edit and test our function with live preview:
Debugging with hypar run
The
hypar run command also makes debugging your Functions easy. In VSCode go to the Run and Debug tab on the left hand side.
The CLI has already made our launch.json file for us — hit the play button to Start Debugging or hit F5.
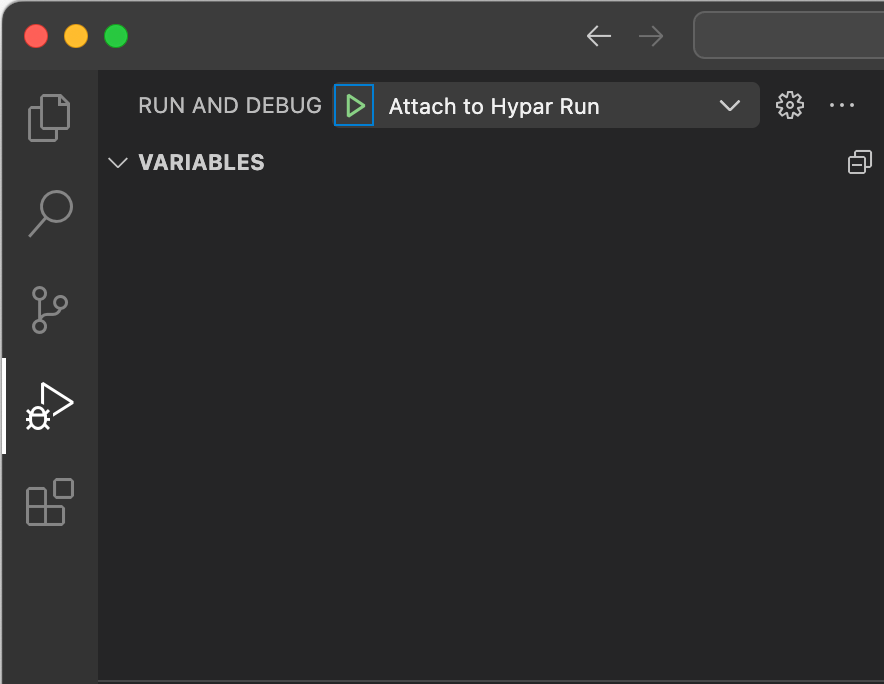
We’re now debugging our local function!
Breakpoints inside of VSCode will hit during executions which are triggered by Function updates. You can start debugging the moment the Function server has launched, indicated by the local function beginning to process dependencies:
javascriptLoading all referenced assemblies in Dependencies.