
One of Hypar’s main benefits is live metrics: as you plan, Hypar continuously measures your model and compares it to your program.
The metrics panel
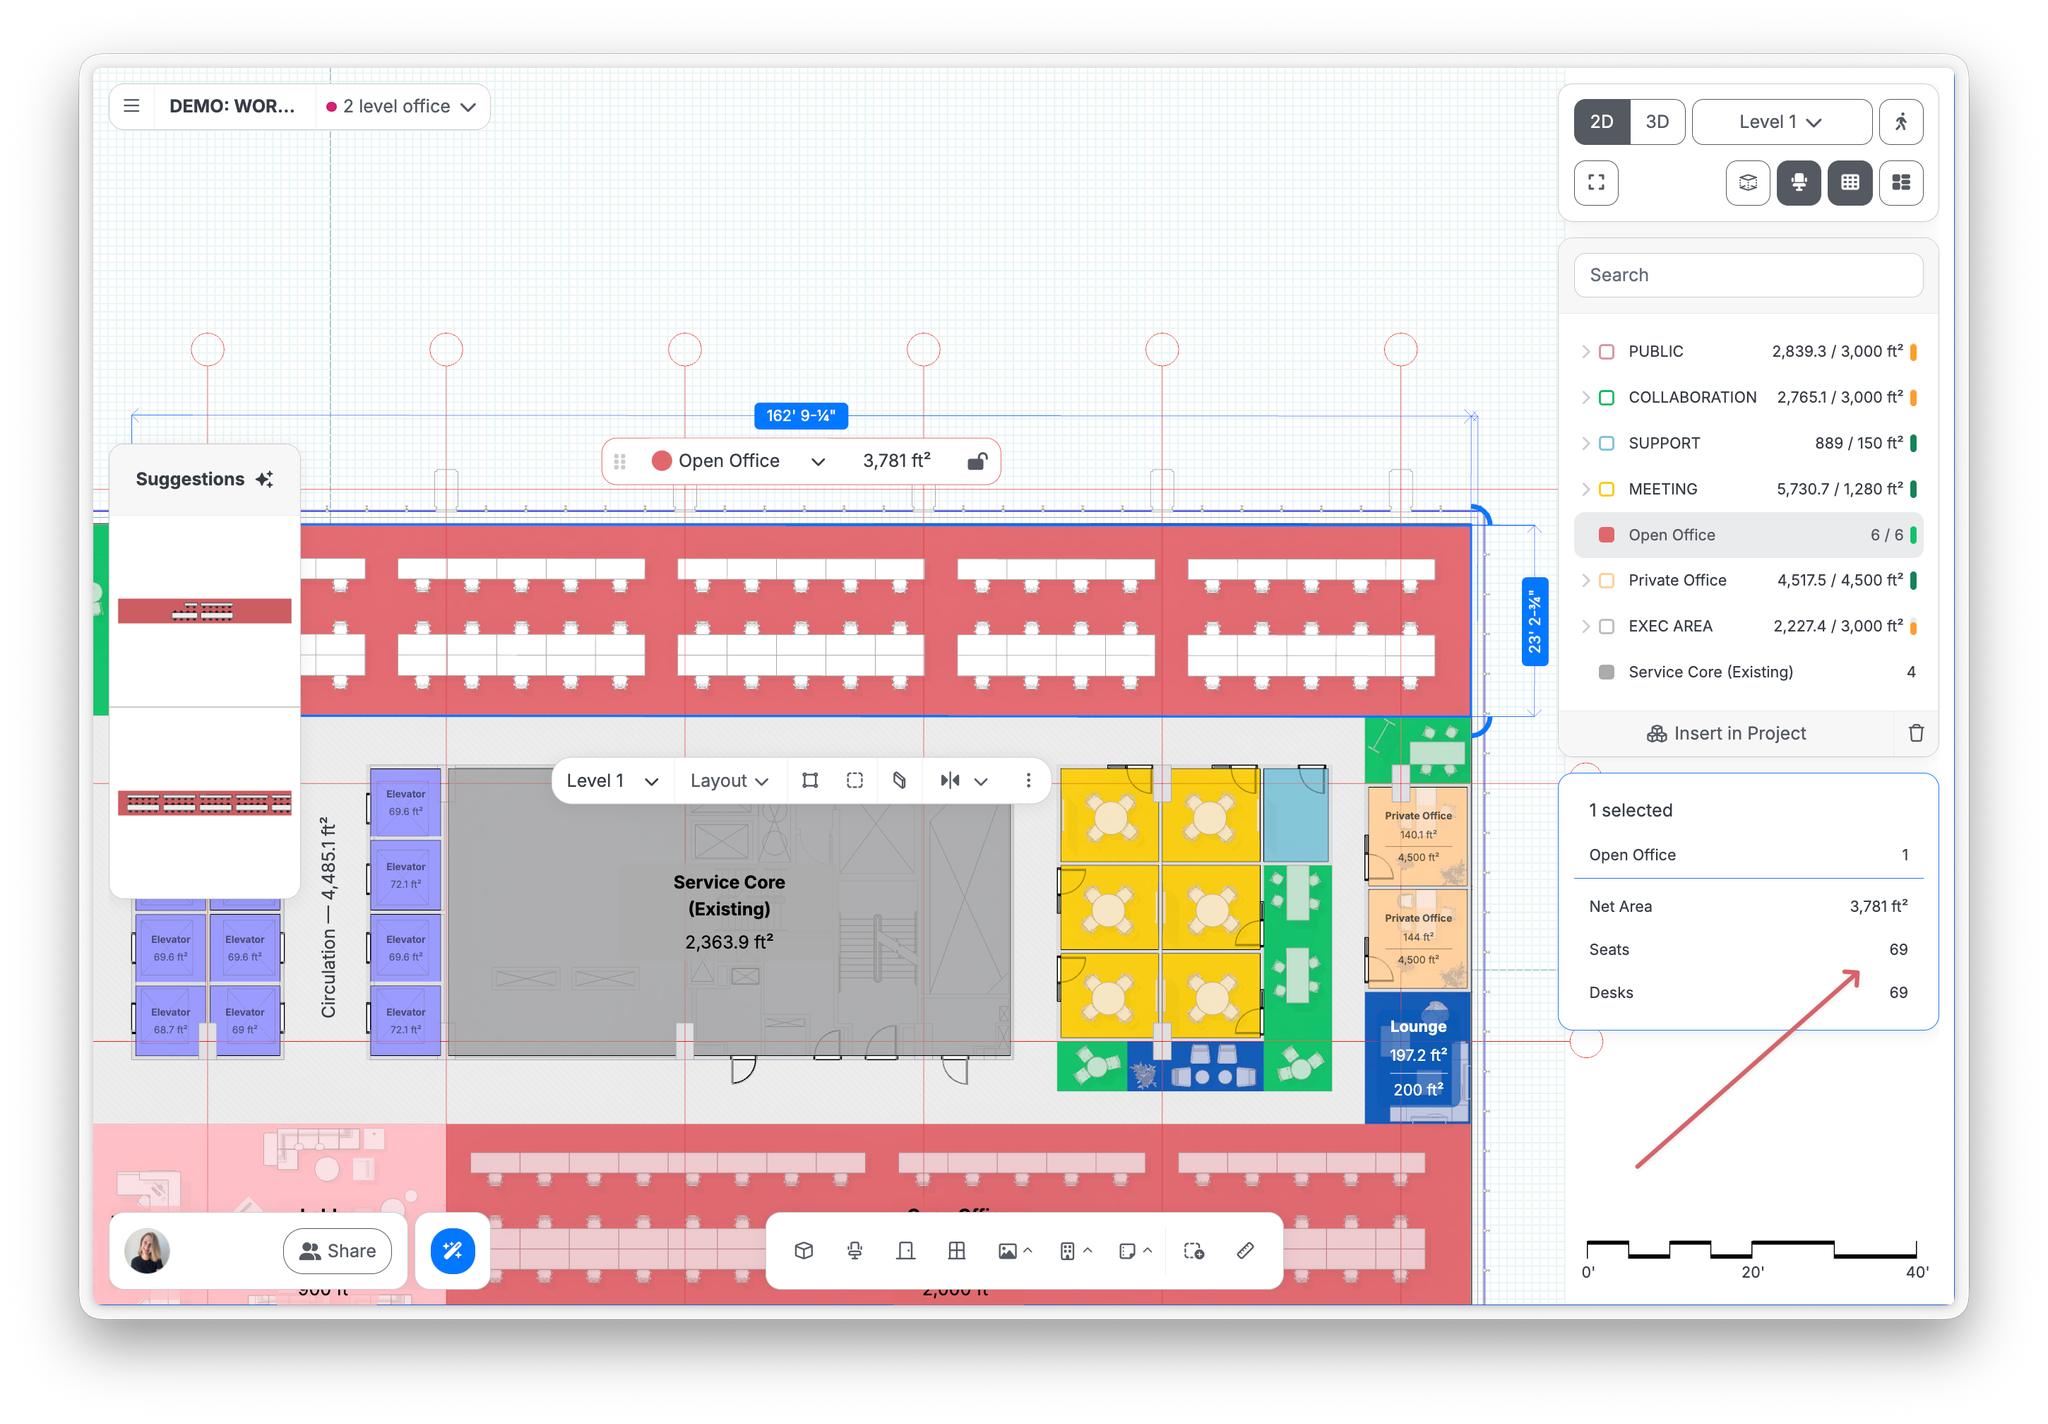
The metrics panel (top-right) shows live figures for the project.
- Counts, including actual vs. target counts
- Net Areas, measured from the inside face of walls, of program groups
- Net Area
- Gross Floor Area
- Gross-up factors at building and department level
For the full breakdown of requirements against what's placed, click Edit Space Program (see Set up program requirements).
Finding a space type
Use the search box at the top of the metrics panel to filter to a space type or requirement. Matches inside collapsed groups are revealed automatically, so you don't have to expand groups to find them. Clearing the search restores your collapse state.
Quick counts
Select any set of elements, or everything, and the panel shows live counts: how many desks in the plan, seats in a space, and the areas that go with them. A fast answer to “how many desks do we have so far?” mid-meeting.
Select a circulation and the panel shows Circulation area for its whole connected corridor section — useful for checking a wing's circulation total at a glance. (In diagram mode, circulation labels on the canvas show just "Circulation" without the area, matching how space labels behave there. The metrics panel still reports the full number.)
Space Labels
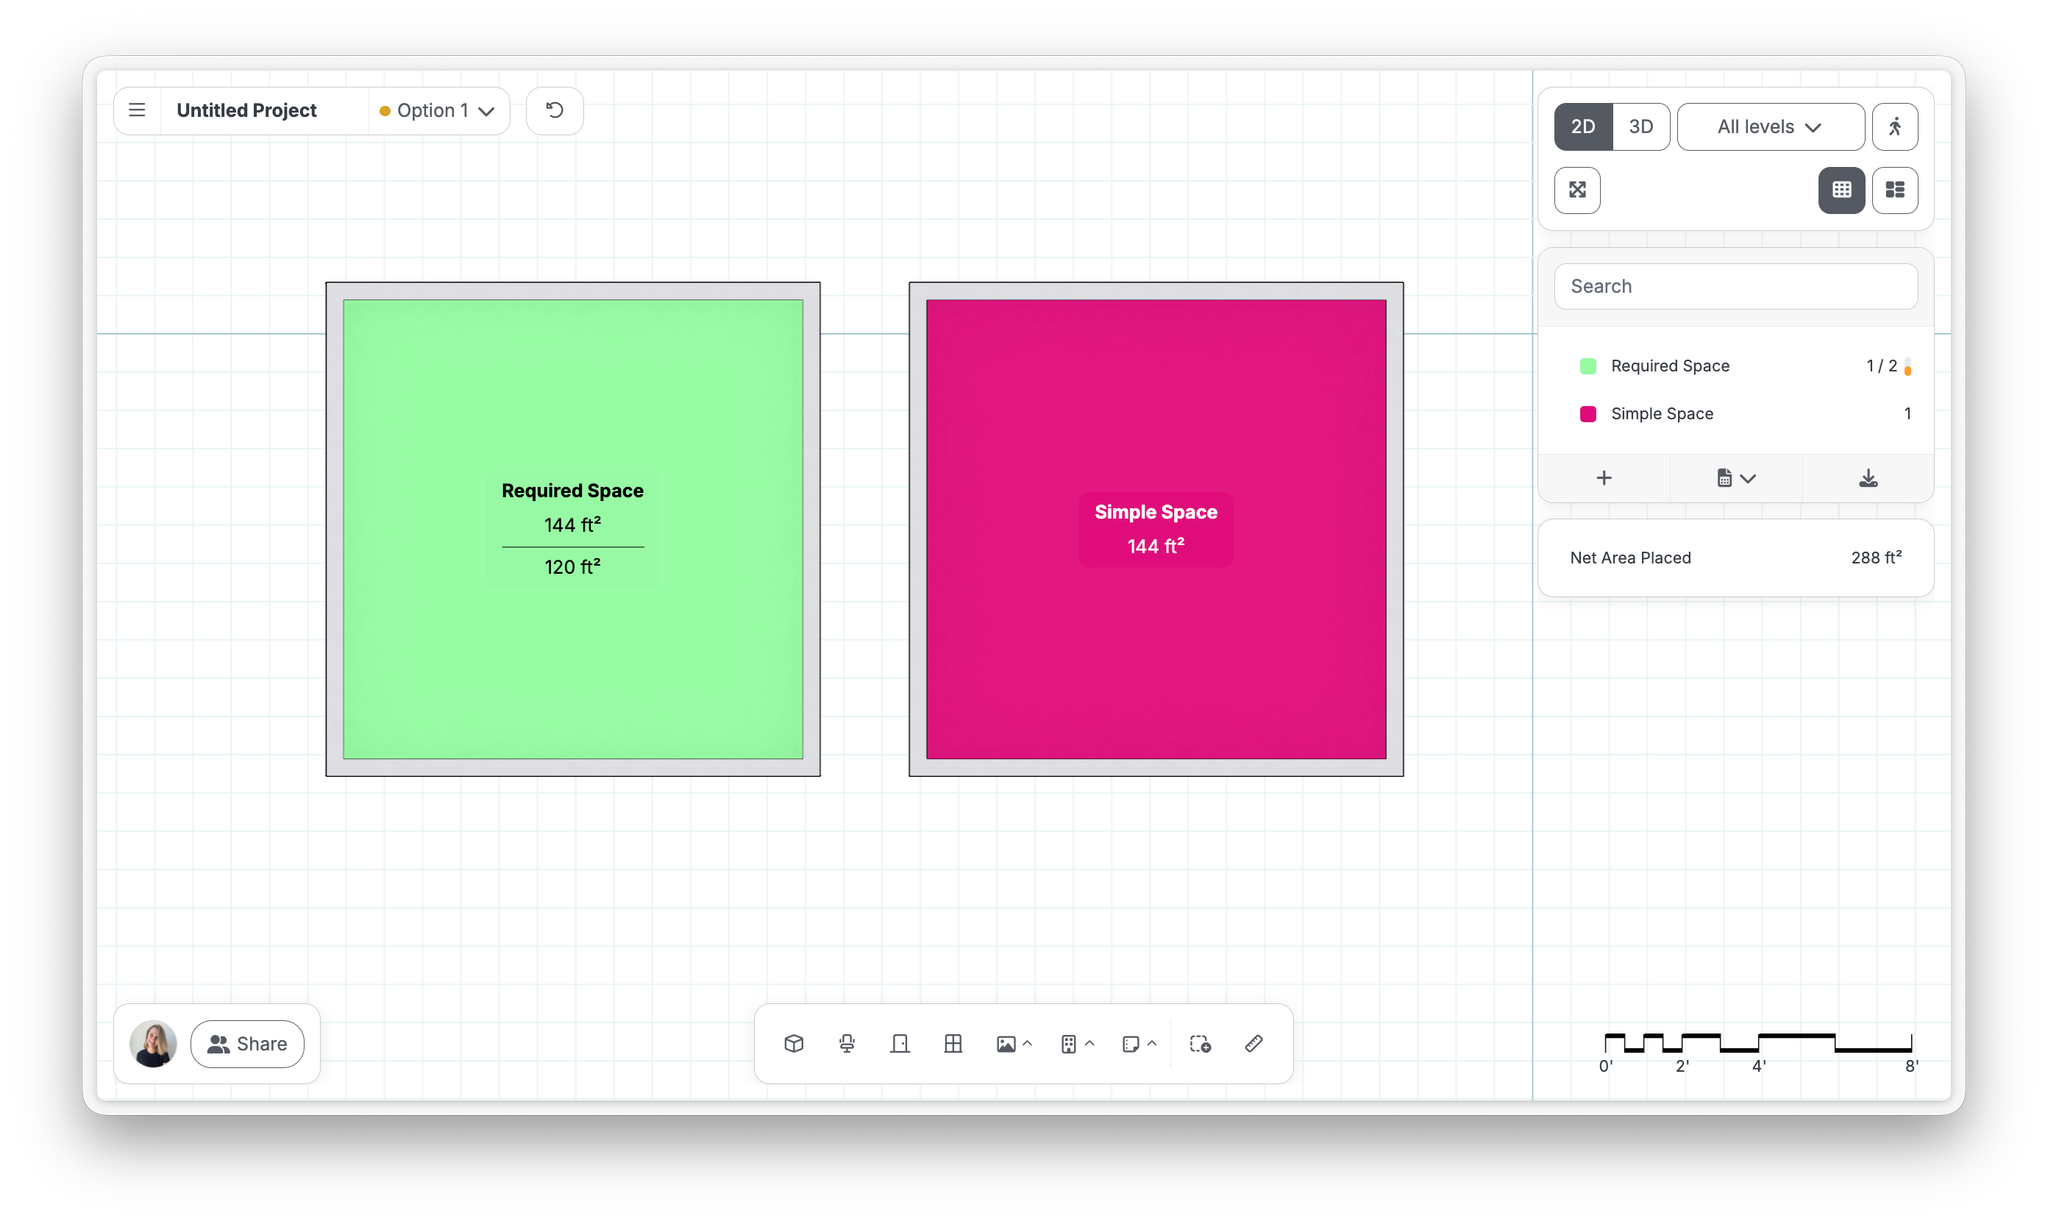
If your space has a target area defined in the requirements, space label will show both your target (programmed) and actual area. If it has no target area, labels will just show actual area, measured from the inside face of the wall.
Export to Excel
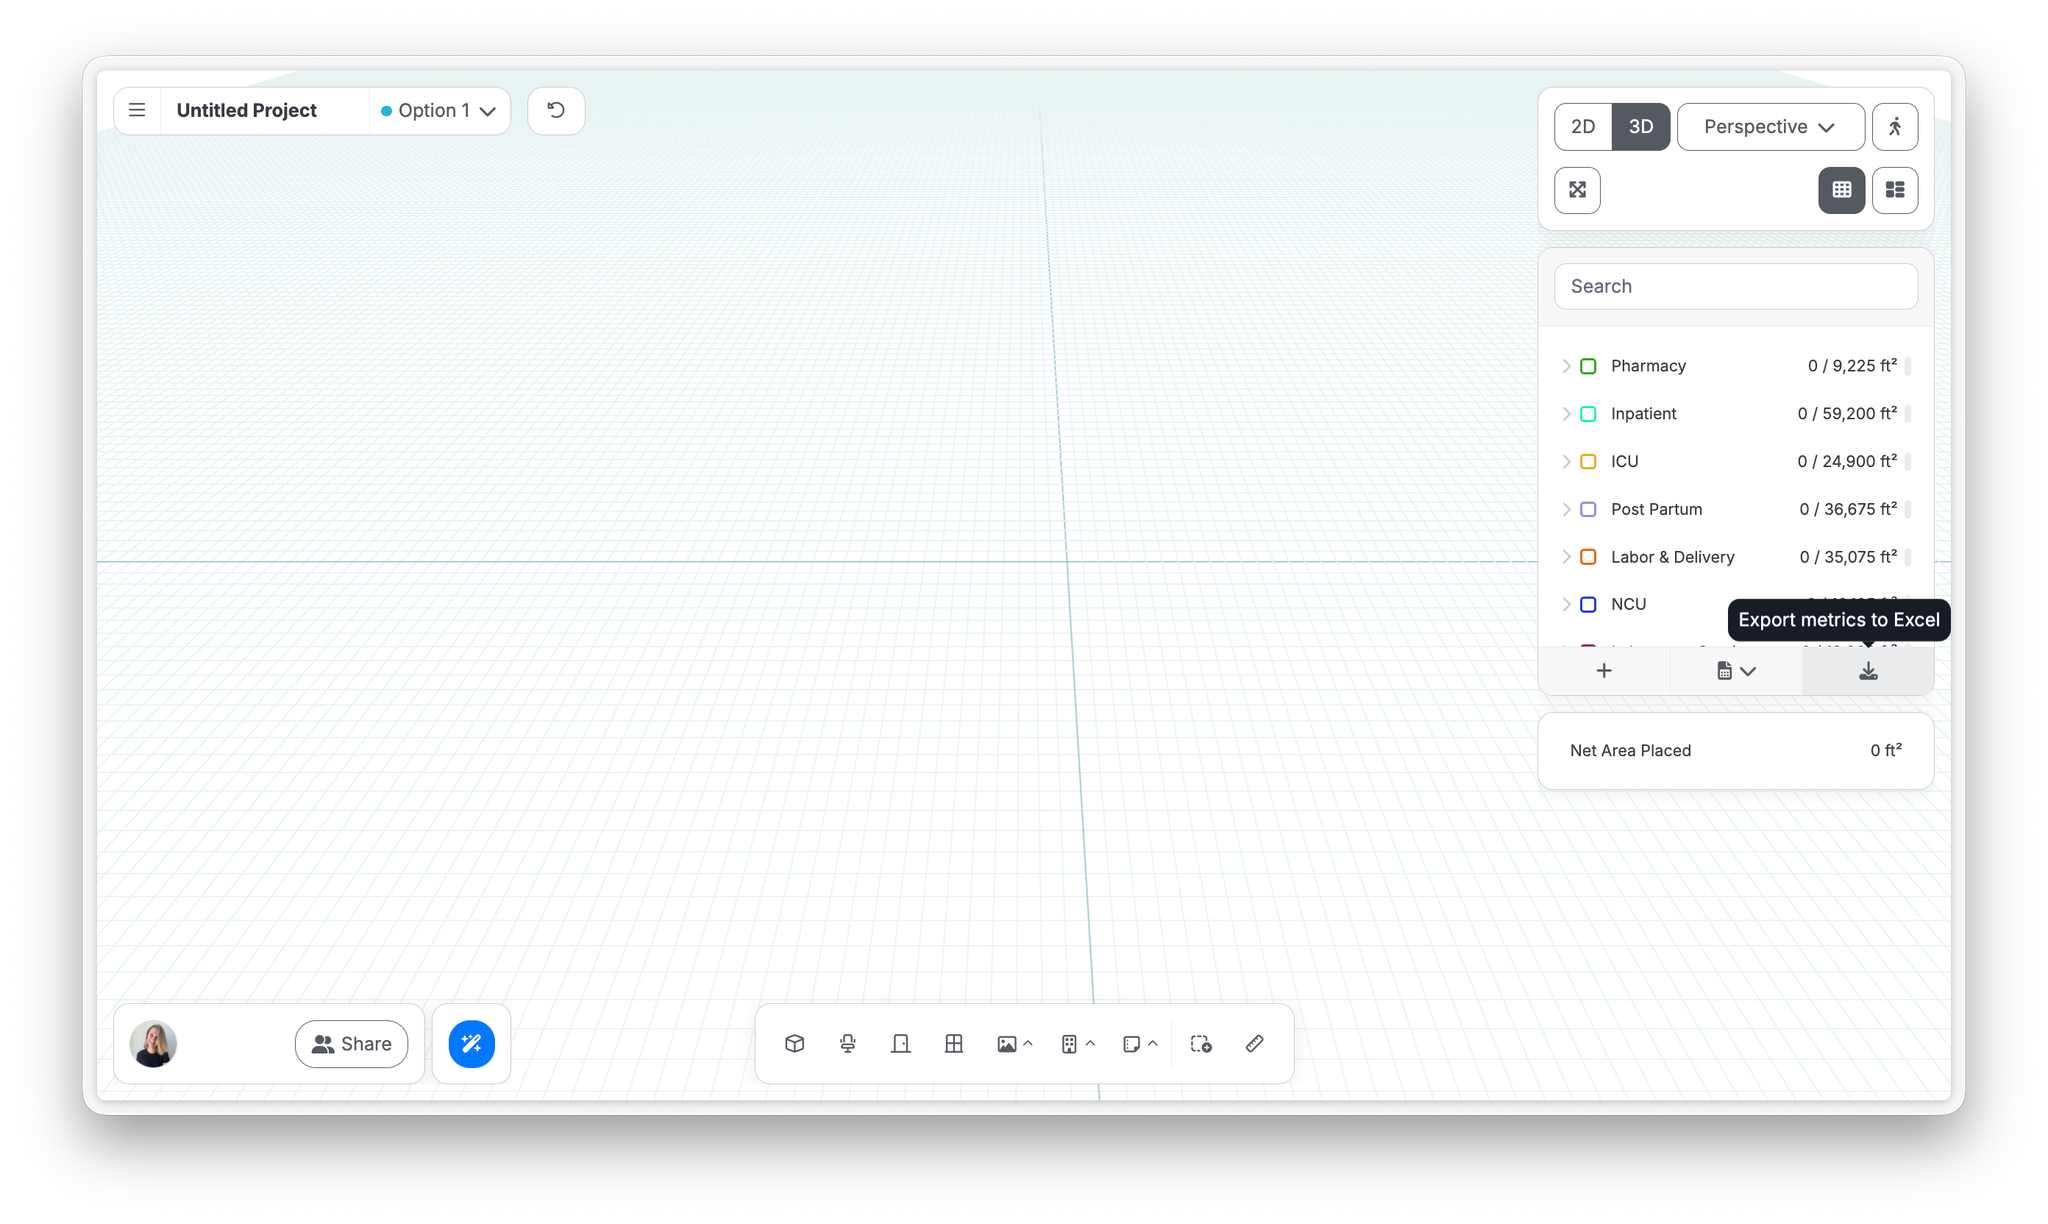
Export metrics to Excel (the button at the bottom of the program panel, or Main menu → Export) produces the full breakdown as a spreadsheet: areas, counts, deviation percentages against target program areas, desk and seat counts in detail, and per-space and per level metrics on a separate tab, ready to filter, pivot, and chart.
Last verified against Hypar v0.2.038 — September 10, 2026.